Setup Velero notifications with Grafana
Introduction
If you are a velero user like myself, you’ve probably run into a problem where you would like to be notified when backup fails. Unfortunately velero doesn’t support this by default. In this short post I’ll show you one easy way to do it.
There are plenty of 3rd part solutions out there, but they are mostly outated or paid.
But there is a simple solution, if you are using prometheus & grafana, just integrate it together.
Here is official documentation for the integration of velero with grafana
Prereq
- working velero backups
- velero successfully outputting metrics
Valero should by default output metrics on port 8085. You can check this by port forwarding traffic from the velero pod.
1
2
#change the namespace name and pod name to your values
kubectl port-forward -n <backup> velero-* 8085:8085
And you should see metrics like so
1
2
3
4
5
6
7
8
9
10
11
12
13
14
15
curl http://localhost:8085/metrics
# HELP go_gc_duration_seconds A summary of the wall-time pause (stop-the-world) duration in garbage collection cycles.
# TYPE go_gc_duration_seconds summary
go_gc_duration_seconds{quantile="0"} 3.26e-05
go_gc_duration_seconds{quantile="0.25"} 3.72e-05
go_gc_duration_seconds{quantile="0.5"} 4.02e-05
go_gc_duration_seconds{quantile="0.75"} 6.69e-05
go_gc_duration_seconds{quantile="1"} 0.001392399
go_gc_duration_seconds_sum 0.064125272
go_gc_duration_seconds_count 785
# HELP go_gc_gogc_percent Heap size target percentage configured by the user, otherwise 100. This value is set by the GOGC environment variable, and the runtime/debug.SetGCPercent function. Sourced from /gc/gogc:percent
# TYPE go_gc_gogc_percent gauge
...
..
.
Expose velero metrics
To expose the velero metrics, we first have to create service, exposing ports on the correct port
1
2
3
4
5
6
7
8
9
10
11
12
13
14
15
16
#vim velero-metrics.yaml
apiVersion: v1
kind: Service
metadata:
  name: velero-metrics
  namespace: backup
  labels:
    k8s-app: velero
    component: velero
spec:
  selector:
    component: velero
  ports:
    - name: metrics
      port: 8085
      targetPort: 8085
Change the values according to your values and apply the manifest
1
kubectl apply -f velero-metrics.yaml
Scrape the metrics from the exposed service
Now we need to tell Prometheus, where and how often to scrape the metrics.
1
2
3
4
5
6
7
8
9
10
11
12
13
14
15
16
17
18
#vim scrape-metrics.yaml
apiVersion: monitoring.coreos.com/v1
kind: ServiceMonitor
metadata:
  name: velero
  namespace: monitoring-system
spec:
  jobLabel: k8s-app
  namespaceSelector:
    matchNames:
      - backup
  selector:
    matchLabels:
      k8s-app: velero
  endpoints:
    - port: metrics
      interval: 30s
      path: /metrics
Again change the values according to your values and apply the manifest
1
kubectl apply -f scrape-metrics.yaml
Grafana dashboard
To visualize the data we need to create a dashboard in the grafana.
But there is also easier way, if you are not familiar with creating grafana dashboards. Velero team has created and maintained dashboard a few years. It’s little outated now, but should still be good starting point from the source you can trust.
Here is the velro dasbhoard which you can import.
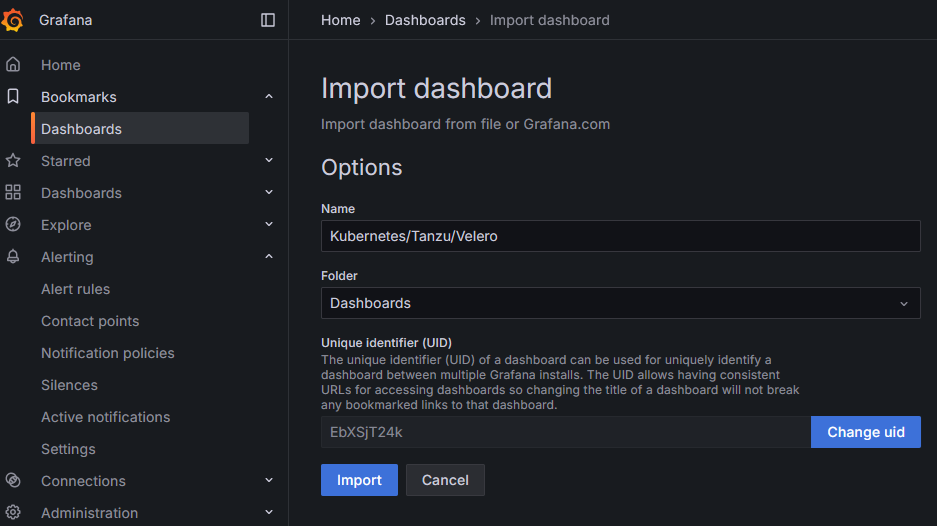
When import is completed, wait few minutes and you should start seeing some metrics.
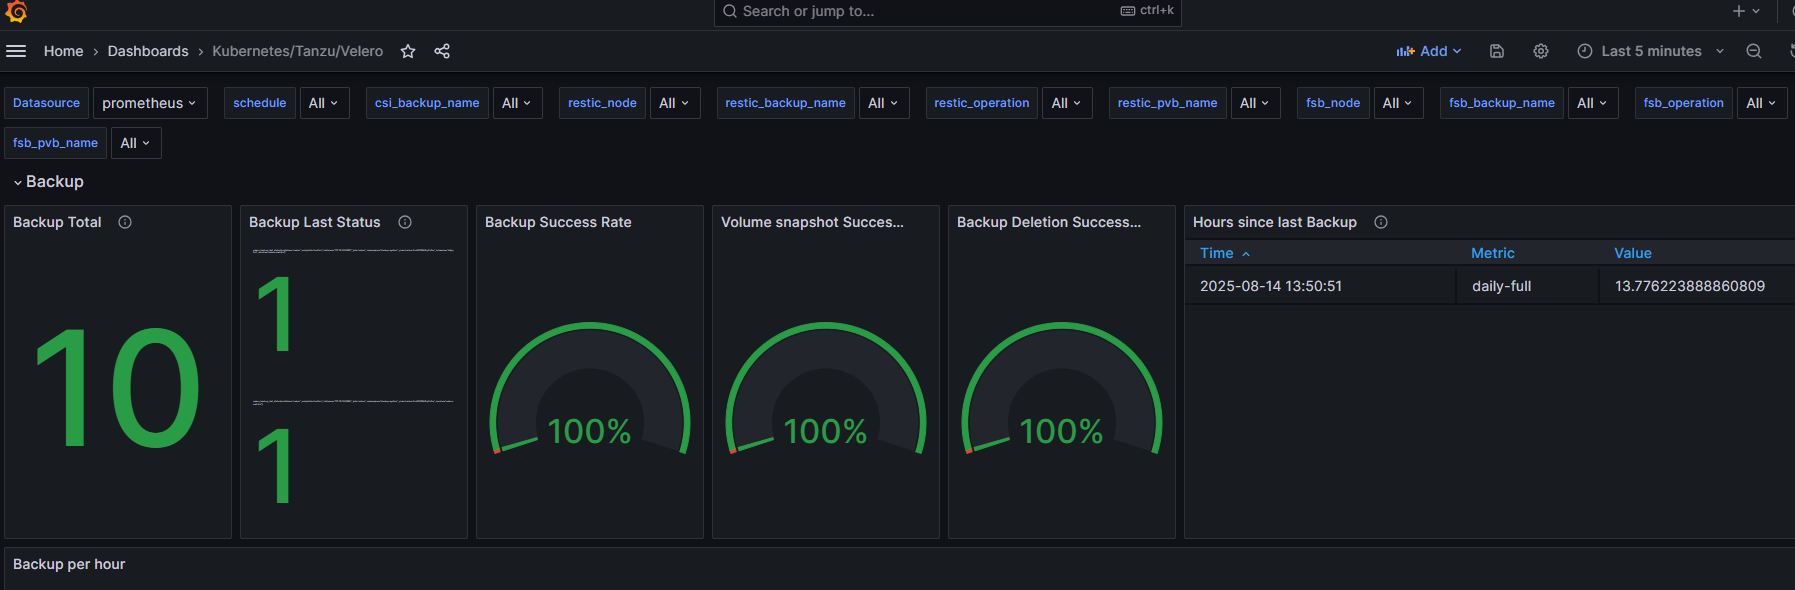
You can adjust it yourself, there are probably multiple panels not working correctly or panels that you don’t care for.
Create notifications policy/channel
Depending on your grafana version this process differs.
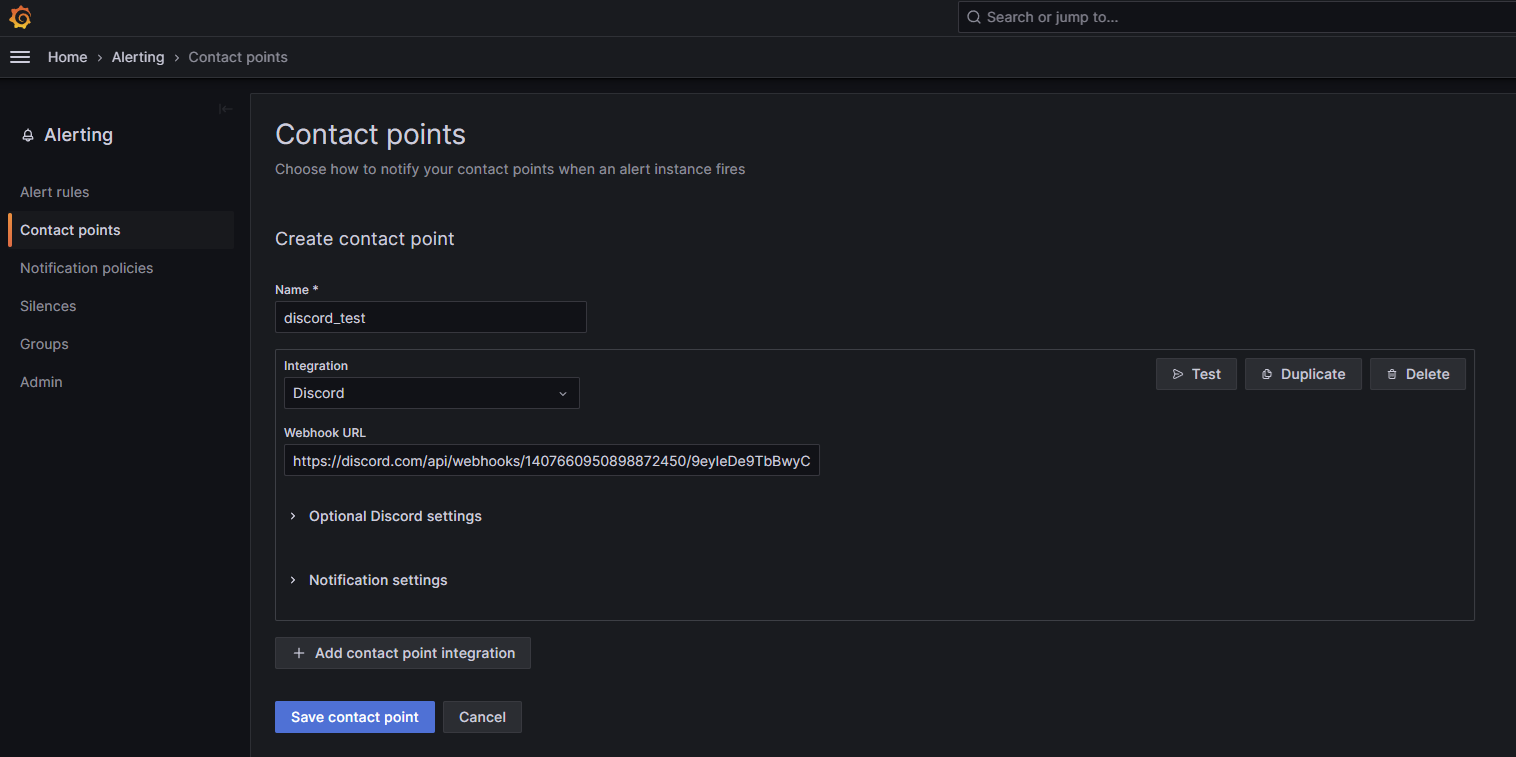
For current version I’m using (11.x.x >), you’ll need to
create contact point (email, discord, slack, telegram…) I’ll use discord as an example
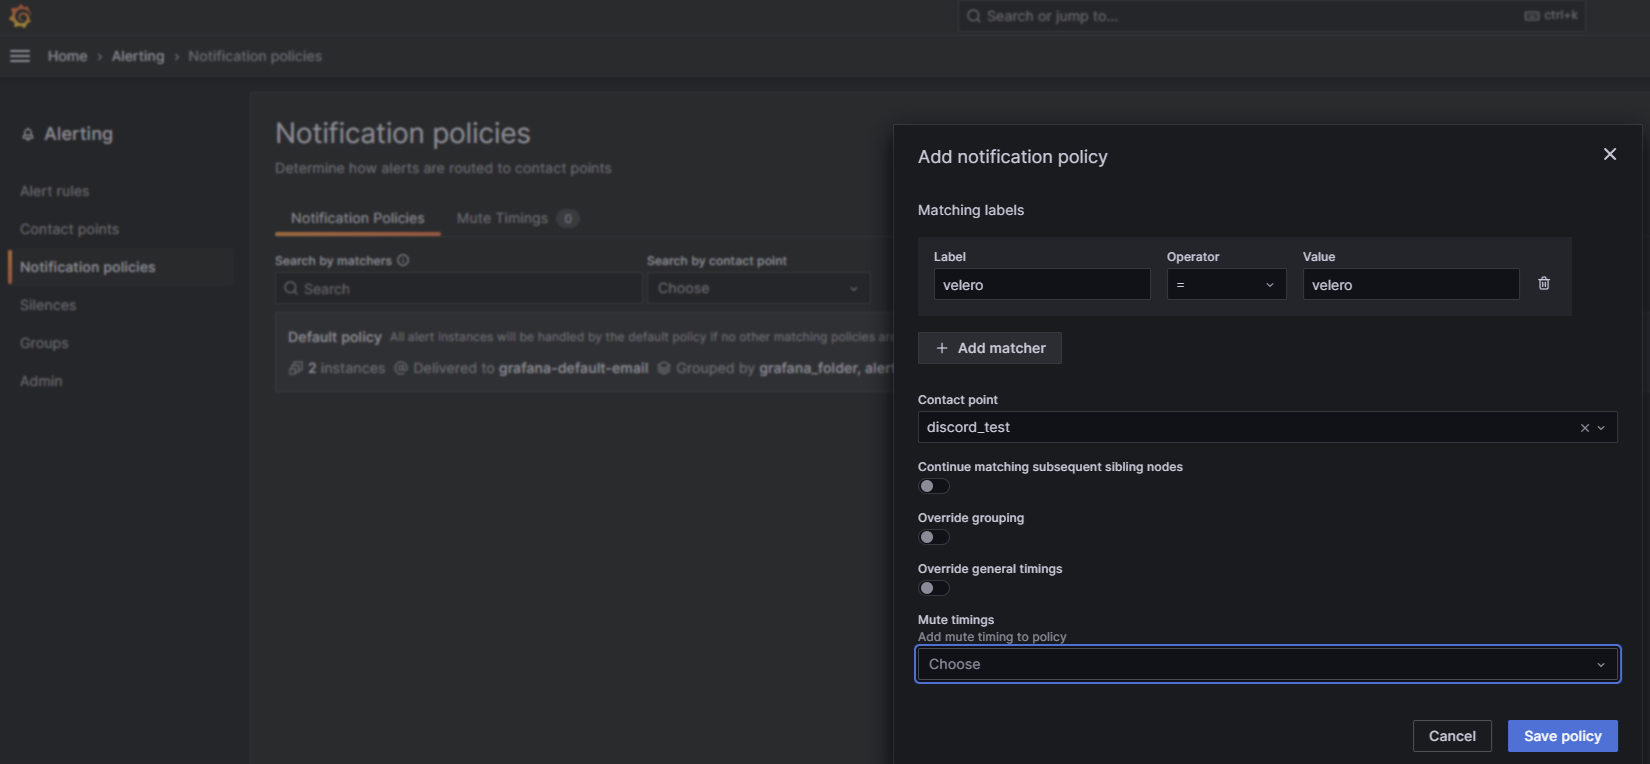
create notification policy Add a label of your liking. I’m going to use (discord=discord)
Create alert
And finally let’s create an alert if backup comes failed or partially failed.
- Go to Velero dashboard (the one we just imported or you’ve created)
- If you are using velero official dashboard just click edit on “Backup per hour” panel
- Go to “Alert” Tab -> Create alert
- Set alert name of your liking
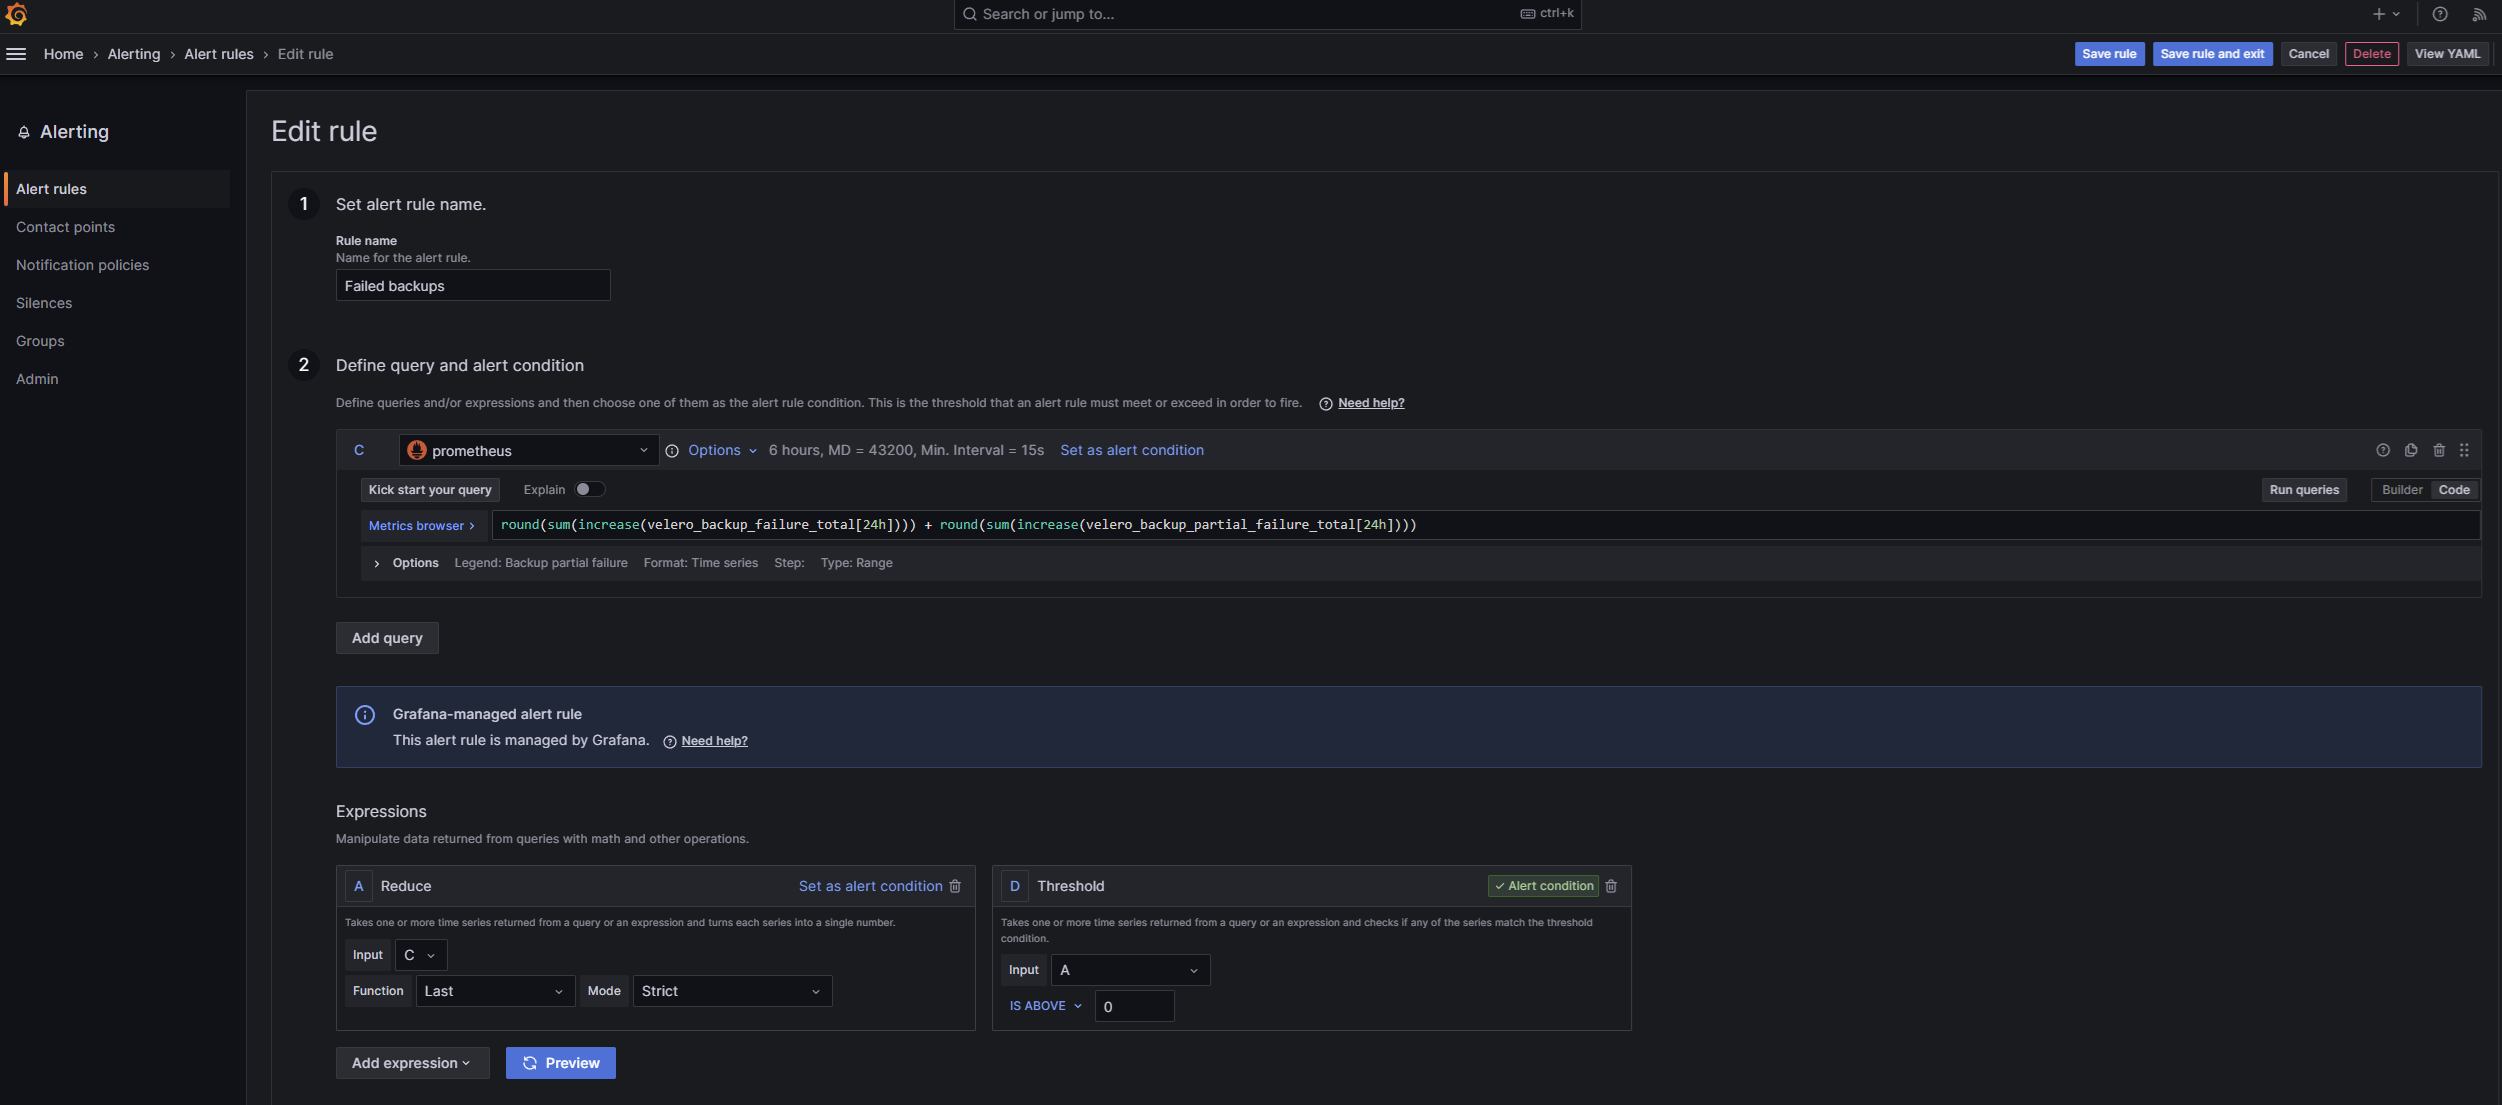
- Define query and alert condition
- I’m goin to use Prometheus as my source of data (your may differs)
- Set the metric query to
1
2
round(sum(increase(velero_backup_failure_total[24h])))
round(sum(increase(velero_backup_partial_failure_total[24h])))
- Set the metric query to
This means that if the backups comes failed or partialy failed, the alert will be triggered.
This could be changed to so many varations, you could create seperate alerts, or change the time frame so it’s only triggered for 1h or week etc… To make it simple let’s go with this query, you may experiment on your own later.
- Set the Expressions This setting tells the grafana how to process the data, which we just give in the form of a metric query.
We first need to create “REDUCE” and give it input from the metric query above (for me it’s C as you can see in the picture) and set the Function to “Last” with Mode “Strict”.
After that we need to create another expression “Threshold” with the Input of reduce we just created (for me that’s A) and gave it a threshold of “IS ABOVE 0”. Now set this expression as “Alert condition”.
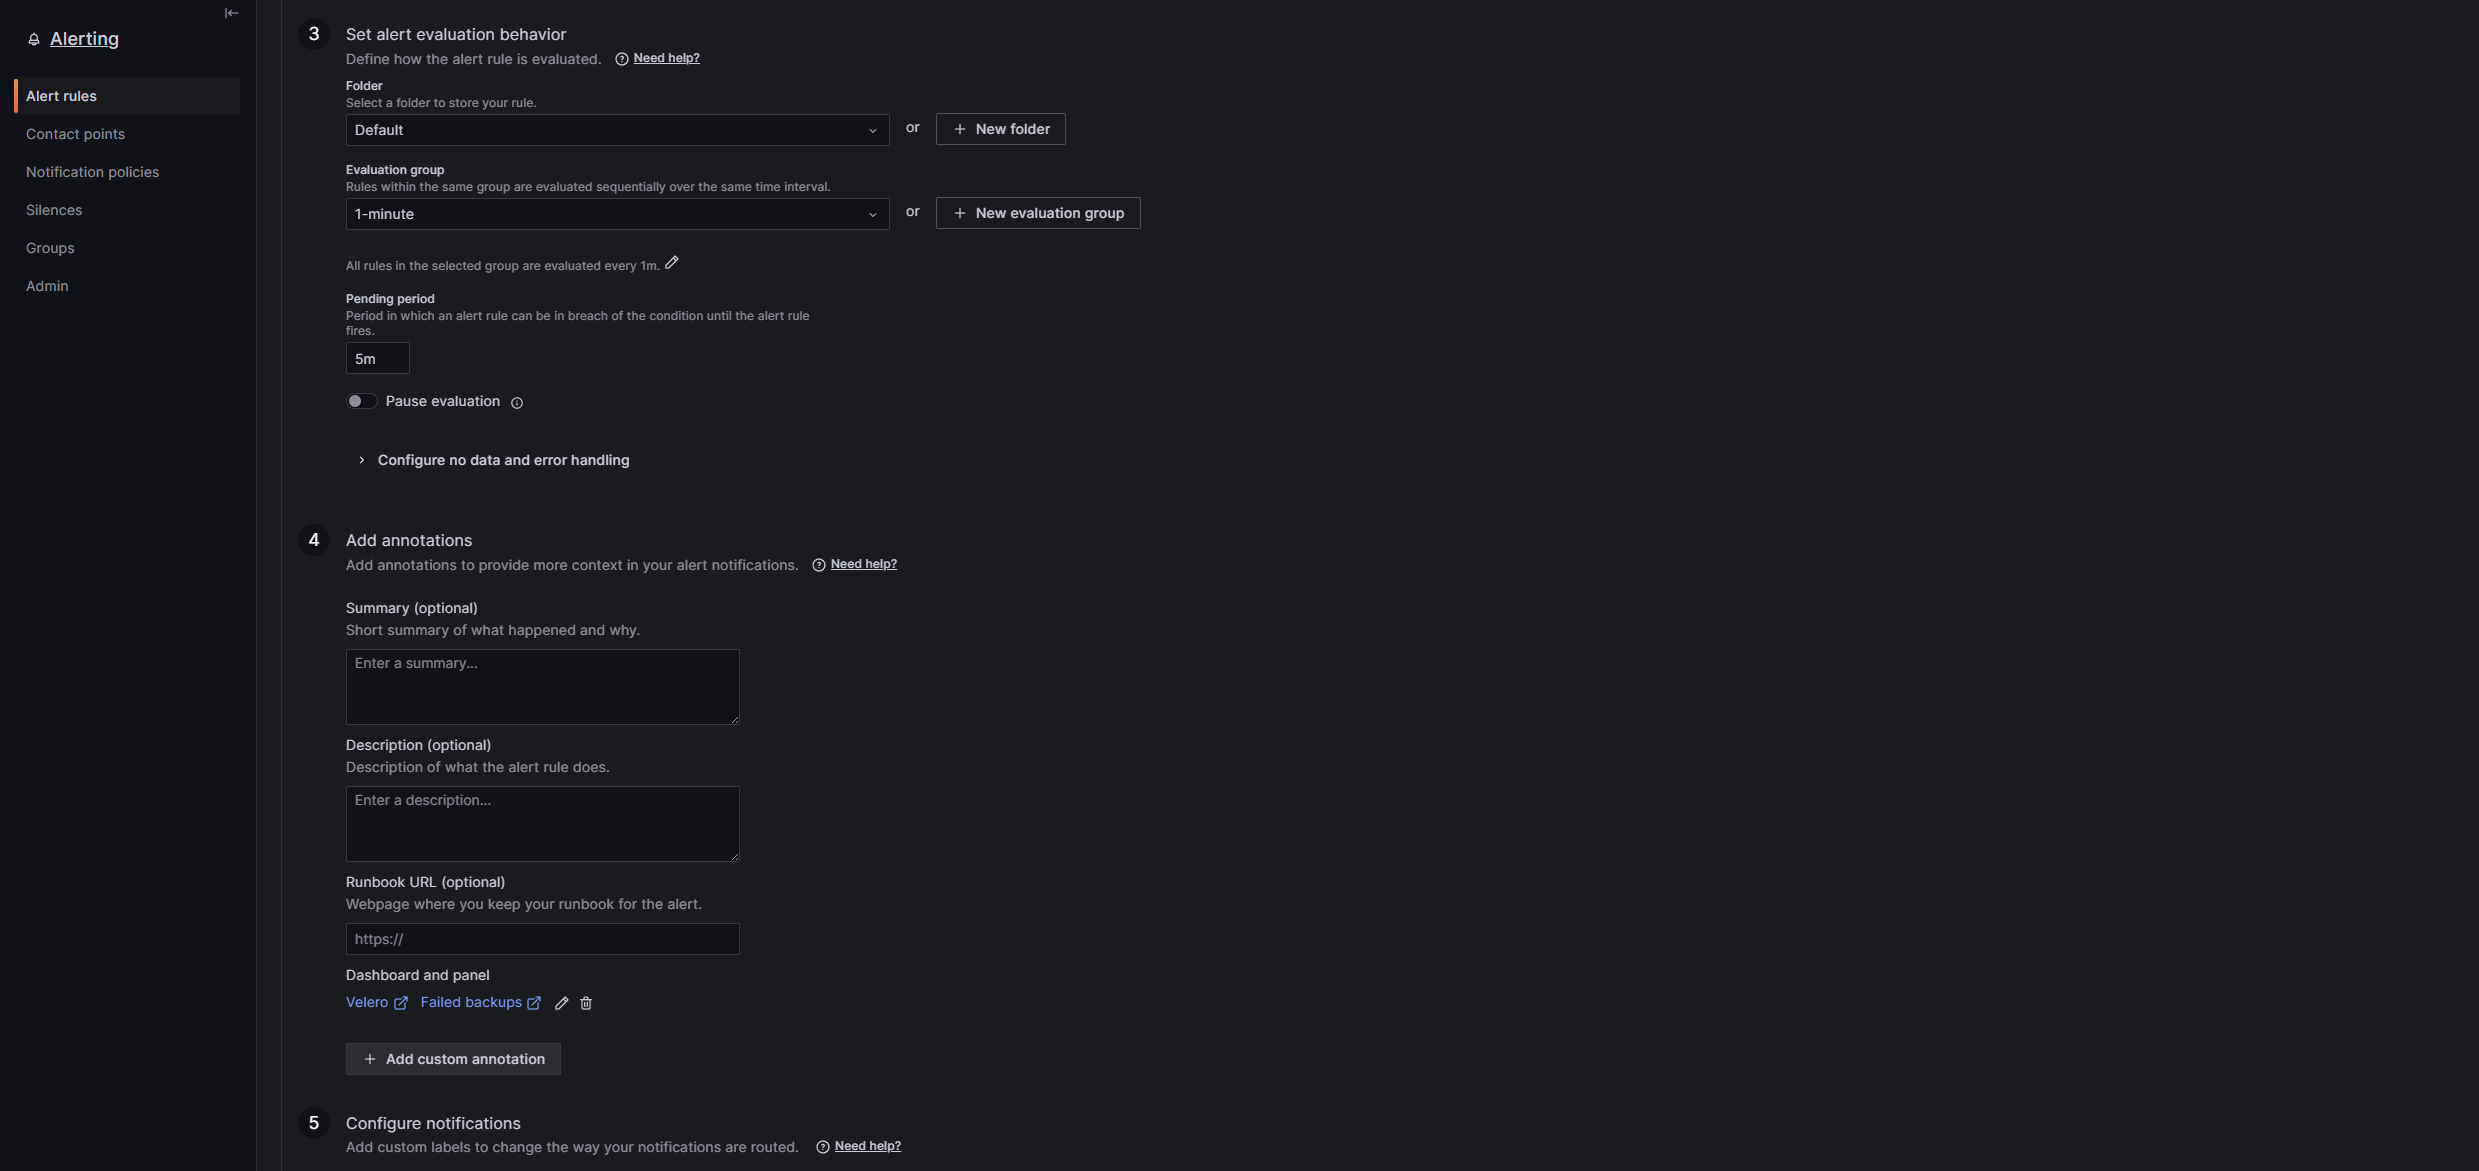
- Set alert evaluation behavior
- Folder: Choose default if you don’t know what to choose. Basically it’s just how the alert is group with other alerts.
- Evaluation group: This settings tells grafana how often to check the conditions for alert to be triggered. You can use “1-minute”.
- Pending period: Set to 5m
- Add annotations You can skip this now. Later you can maybe add a little description on what cluster the problem appeared etc
- Configure notifications
- Labels: Set it to label, which we previously created in contact point, so the alert knows which alerting option it should use. For me the label is “velero=velero”.
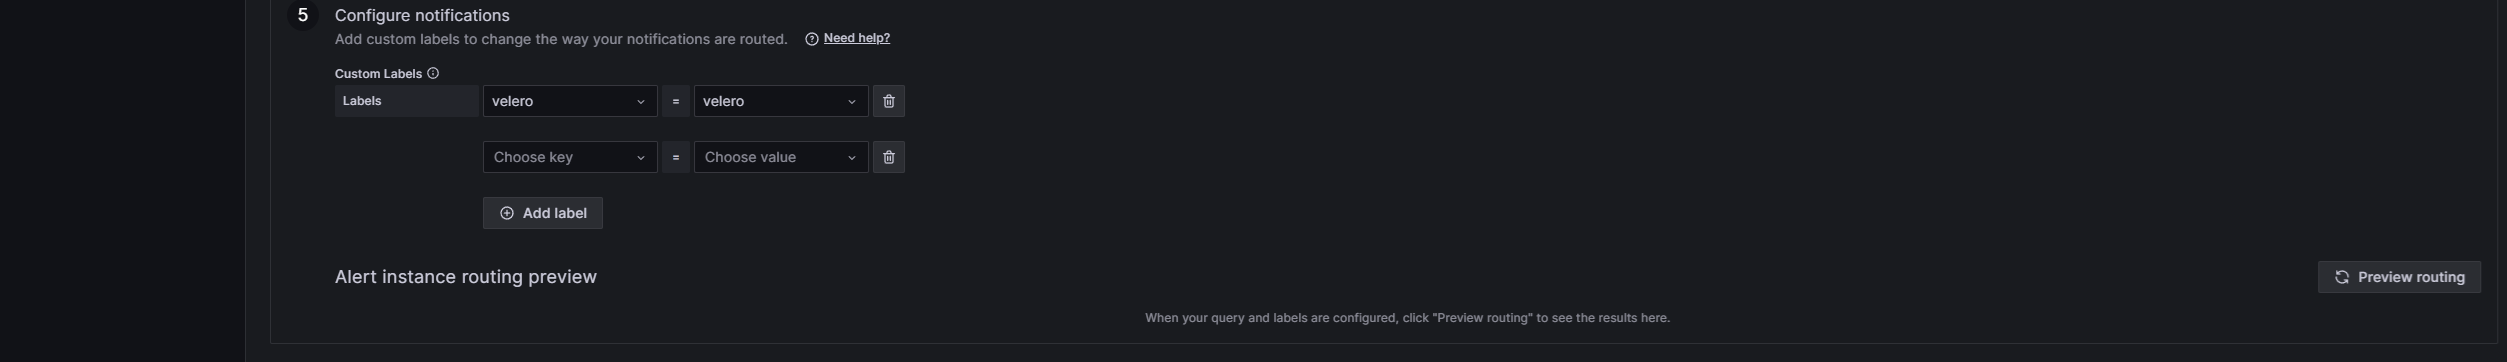
- Save the alert
Test the alert
We can trigger velero failure, to test this alert.
To do so, we can create some scenarios which velero can’t meet and it results in failed status.
I’m usually creating testing NS with pod running busybox and I annotate it with failed status. Then I simply run velero backup
1
2
3
4
5
6
7
8
9
10
11
12
13
14
15
16
17
18
19
20
21
22
23
24
25
26
kubectl create ns velero-fail-test
kubectl -n velero-fail-test run bb --image=busybox:1.36 --restart=Never -- /bin/sh -c 'sleep 3600'


kubectl -n velero-fail-test annotate pod bb \
  'pre.hook.backup.velero.io/command=["/bin/sh","-c","exit 1"]' \
  'pre.hook.backup.velero.io/on-error=Fail' \
  'pre.hook.backup.velero.io/timeout=5s' --overwrite


  velero -n backup-system backup create fail-hook --include-namespaces velero-fail-test --wait
velero -n backup-system backup describe fail-hook
velero -n backup-system backup logs fail-hook | grep -i hook


#cleanup
kubectl delete ns velero-fail-test


velero -n backup-system backup delete fail-hook --confirm
##
After a few minutes, you should receive the alert and from now on you can sleep without a worry! Just kidding, there is always something that’s going to break right? Cheers.