Visualize Unifi metrics in the Grafana
Introduction
In this previous post I’ve showed you how you can use grafana to check on your Qbitorrent metrics, so let’s continue this grafana trend with visualizing Unifi metrics now!
We can do so with the help of unpoller
What is Unpoller?
TLDR unpoller allows you to collect the data from your UniFi network controller, then save it to the database (we will use influx DB in this case, but you can use prometheus as well) and display it in the grafana
For more info checkout their documentation with the description or if you just want to follow their install guide as well
UniFi
Create delegated UniFi user
Login to your Unifi Controller -> admins -> Add new site admin
- Uncheck “Remote Access”
- Choose name and password of your liking
- Set the role “Site admin”
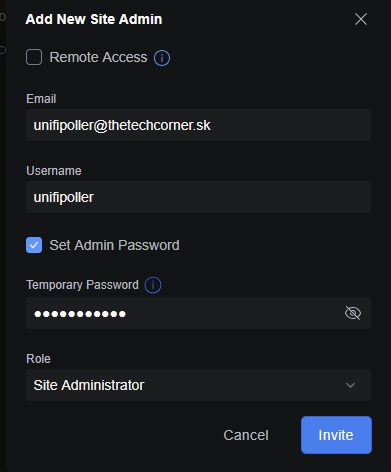
Try logging in with the new user and set permanent password.
Influx DB
Create influx DB
Depending on your setup, you can run it on docker or LXC with the proxmox scripts as me
1
https://community-scripts.github.io/ProxmoxVE/scripts?id=influxdb
Simply run following command in the proxmox node bash
1
bash -c "$(curl -fsSL https://raw.githubusercontent.com/community-scripts/ProxmoxVE/main/ct/influxdb.sh)"
Create bucket
After you install influxdb and login, you need to create new bucket (which in short is it’s own isolated database, you can have multiple these buckets/databases in parallel)
To do so go to -> Buckets -> Create new bucket Name it: “unifi” 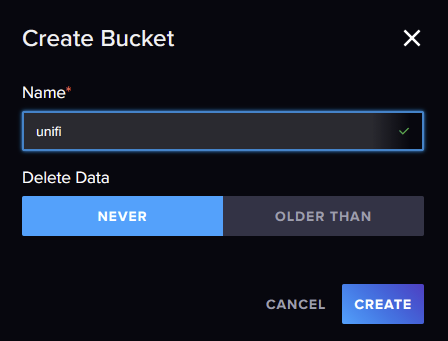
Generate API token
To allow services access to this database/bucket we need to generate API token
Go to API Tokens -> Generate API Token -> Custom Api Token
- Set description of your liking
- Under Resources check both Read && Write for our newly created bucket “unifi”
And Click on Generate! 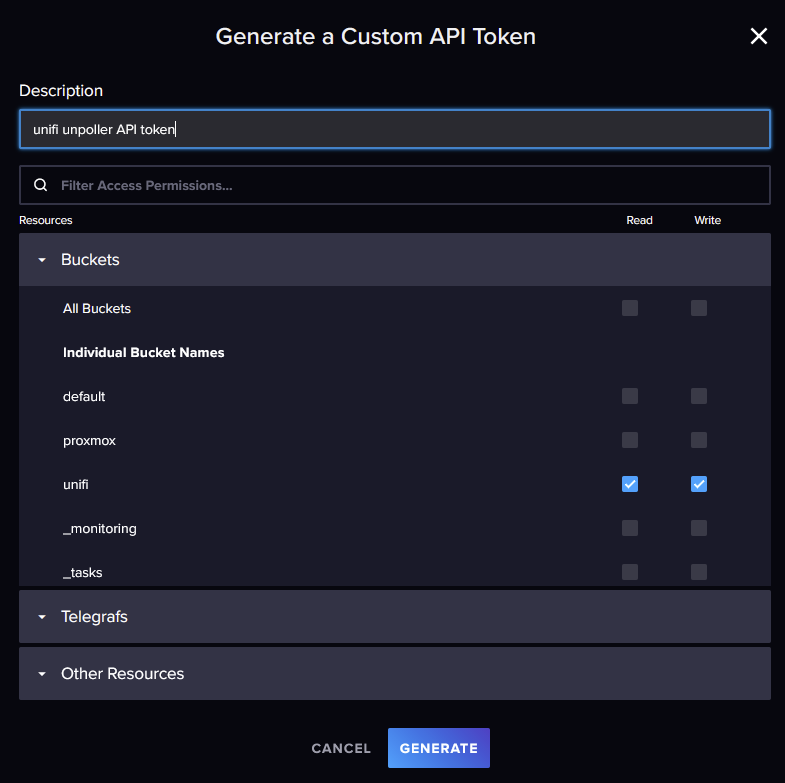
Unifi-poller
Configure && Run unifi-poller
Easiest way is to run as docker container with docker-compose.
You can find the official docker-compose on their git here
1
2
3
4
5
6
7
8
9
10
11
12
13
14
15
16
17
18
19
20
21
version: "3.8"

services:
  unifi-poller:
    container_name: unifi-poller
    image: ghcr.io/unpoller/unpoller:${POLLER_TAG}
    restart: always
    environment:
      UP_INFLUXDB_URL: ${INFLUXDB_URL}
      UP_INFLUXDB_ORG: ${INFLUXDB_ORG}
      UP_INFLUXDB_BUCKET: ${INFLUXDB_BUCKET}
      UP_INFLUXDB_AUTH_TOKEN: ${INFLUXDB_ADMIN_TOKEN}

      UP_UNIFI_CONTROLLER_0_URL: ${UNIFI_URL}
      UP_UNIFI_CONTROLLER_0_USER: ${UNIFI_USER}
      UP_UNIFI_CONTROLLER_0_PASS: ${UNIFI_PASS}
      UP_UNIFI_CONTROLLER_0_SITE: ${UNIFI_SITE}
      UP_UNIFI_CONTROLLER_0_VERIFY_SSL: "false"

      UP_POLLER_DEBUG: ${POLLER_DEBUG}
      UP_UNIFI_DEFAULT_SAVE_DPI: ${POLLER_SAVE_DPI}
And now we just need to create the values.txt file, which is going to be unique to everybody!
Change all of the values according to your created user and setup.
1
2
3
4
5
6
7
8
9
10
11
12
13
14
15
16
# unpoller
POLLER_TAG=latest
POLLER_DEBUG=false
POLLER_SAVE_DPI=false
# UniFi
UNIFI_USER=unifipoller
UNIFI_PASS=unifipoller
UNIFI_URL=https://10.1.1.37:8443
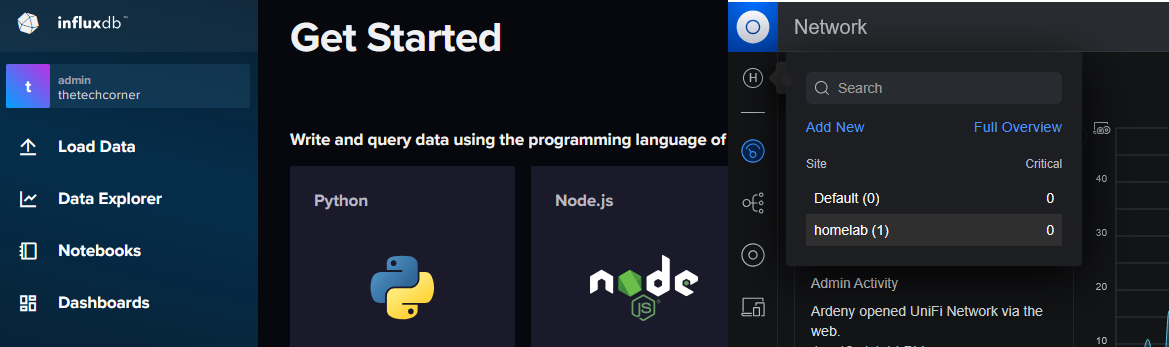
UNIFI_SITE=homelab #you can get this site info in unifi controller top left corner, check the picture under this post
# InfluxDB v2
INFLUXDB_URL=http://10.1.1.32:8086
INFLUXDB_ORG=thetechcorner #if you don't remember your org you can get this info in the influxdb top left corner, check the picture under this post
INFLUXDB_BUCKET=unifi
INFLUXDB_ADMIN_TOKEN=xxxxxxxxxxxxxxxxxxxxxxxxxxxxxxxxxxxxxxxxxxxxxxxxx
Then run the container, if everything is working you should be able to get some info from the container logs
Something like this
1
2
3
4
5
2026/01/16 12:15:54 [INFO] UniFi Metrics Recorded. Site: 1, Client: 2, Gateways: 0, UAP: 1, USW: 0, IDs/Event/Alarm/Anomaly: 0/0/0/0, DPI Site/Client: 0/0, Point: 14, Fields: 470, Bytes: 11047, Err: 0, Dur: 5ms

2026/01/16 12:16:24 [INFO] UniFi Metrics Recorded. Site: 1, Client: 2, Gateways: 0, UAP: 1, USW: 0, IDs/Event/Alarm/Anomaly: 0/0/0/0, DPI Site/Client: 0/0, Point: 14, Fields: 470, Bytes: 11050, Err: 0, Dur: 26ms

2026/01/16 12:16:54 [INFO] UniFi Metrics Recorded. Site: 1, Client: 2, Gateways: 0, UAP: 1, USW: 0, IDs/Event/Alarm/Anomaly: 0/0/0/0, DPI Site/Client: 0/0, Point: 14, Fields: 470, Bytes: 11047, Err: 0, Dur: 5ms
You can also use portainer stacks if you are more comfortable with that (don’t worry password if fake) 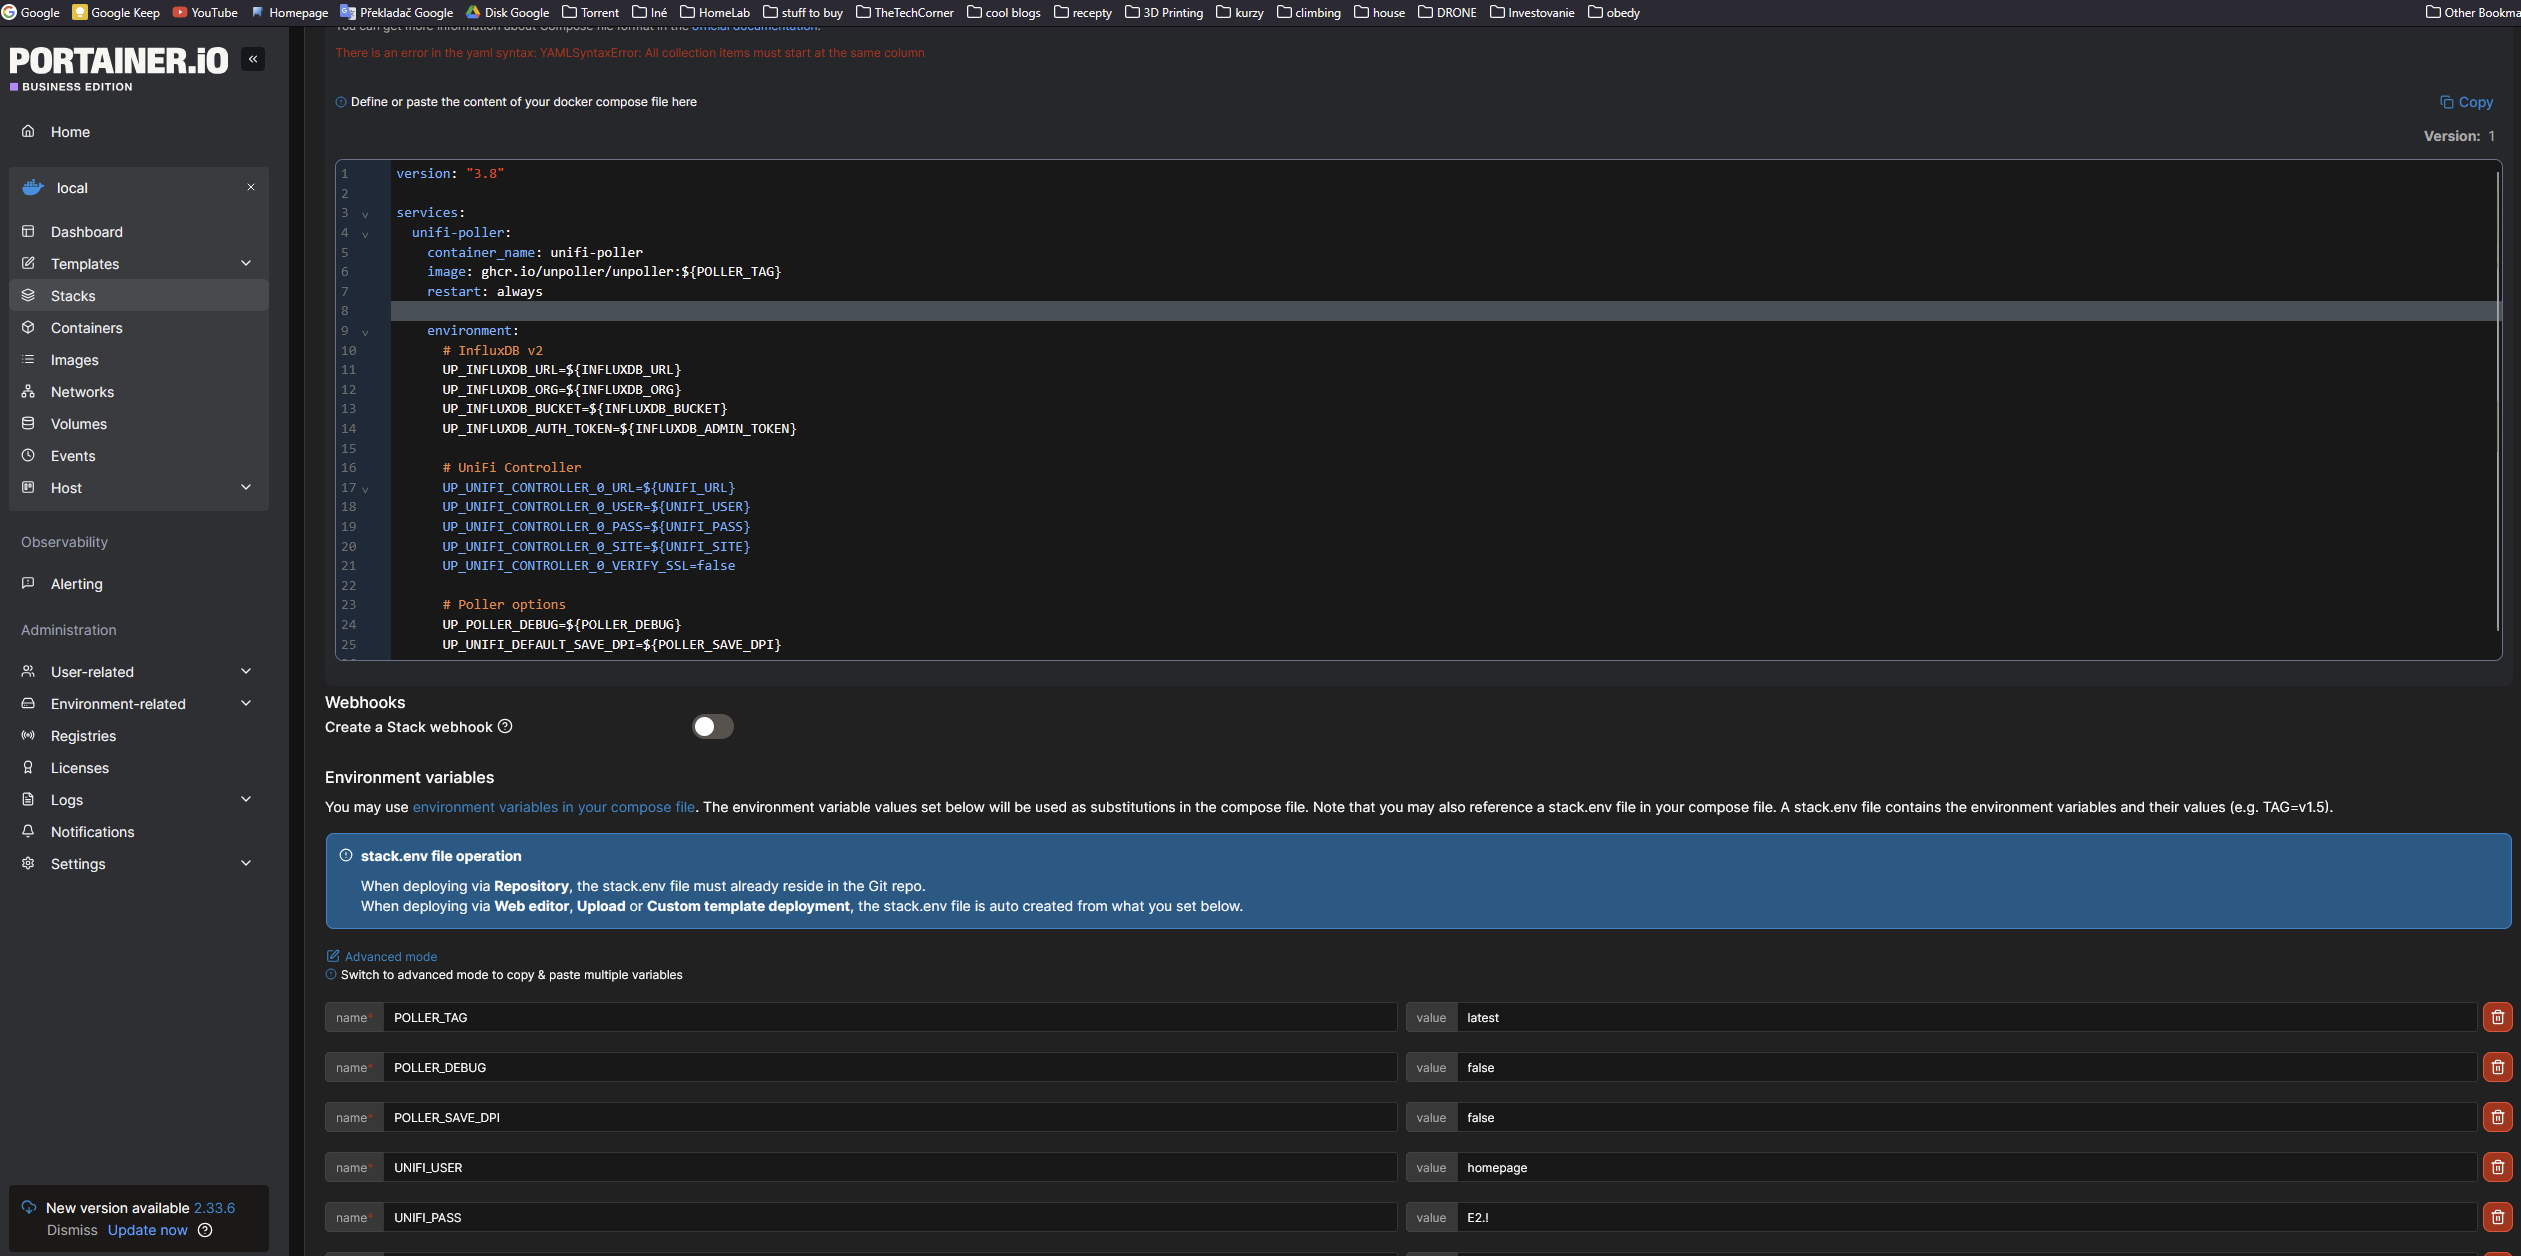
Grafana
Create new data source
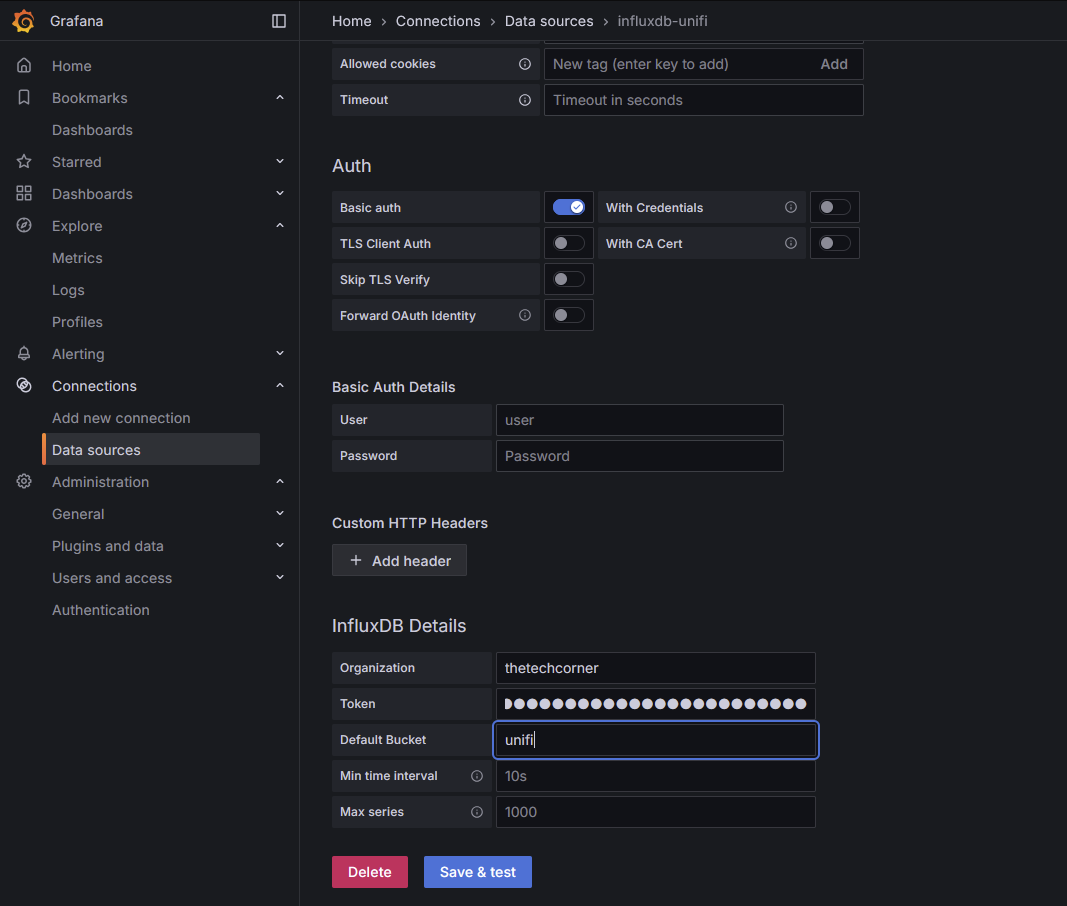
Go to connections -> Data sources -> Add new data source -> InfluxDB
- Name: influxdb-unifi
- Query Language: Flux
- HTTP -> URL: “http://10.1.1.32:8086” #IP of unpoller container change it to your IP/port
- InfluxDB details -> Organization: “thetechcorner” #change to your influxDB organization
- InfluxDB details -> Token: “xxxxxxxxxxxxxxx” #put your influxdb bucket token we have created previously
- Default Bucket: unifi #change to your bucket name if differ
Click on “Save & Test”, if everything is working you should see 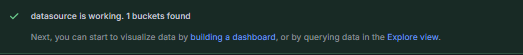
Create/import new dashboards
There are many unipolar dashboards, you can check them all on grafana.com
Some are for influxDB (our setup) and some are for prometheus database, if you don’t choose correct ones based on your database it won’t work.
Also the dashboards are sorted to following categories, choose the ones according to your needs 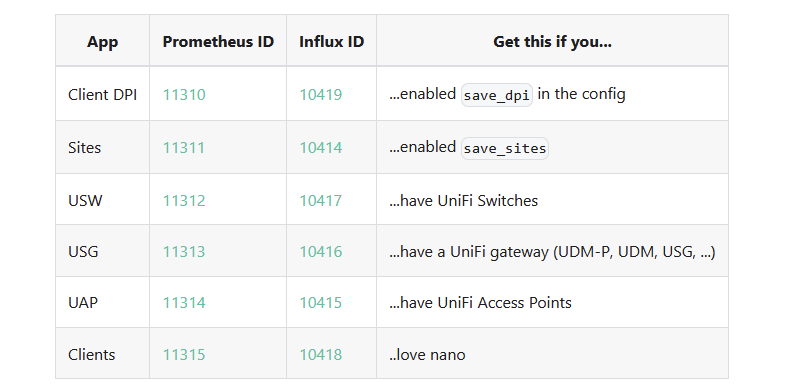
Dashboards for influxdb
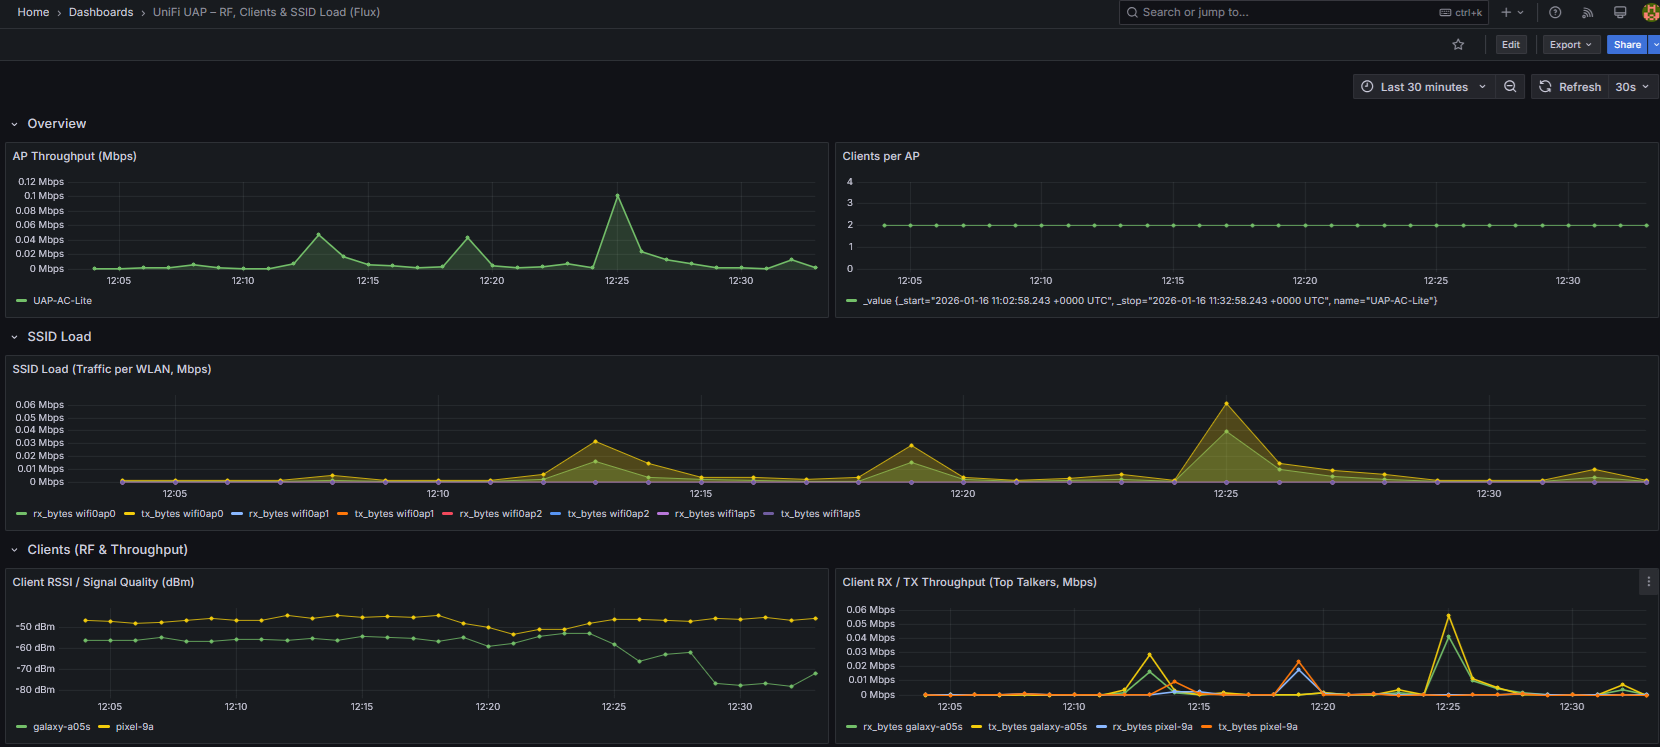
Example of influx db dashboard
Go to Dashboards -> New -> Import dashboard -> Pate the link of dashboard of your liking and press Load 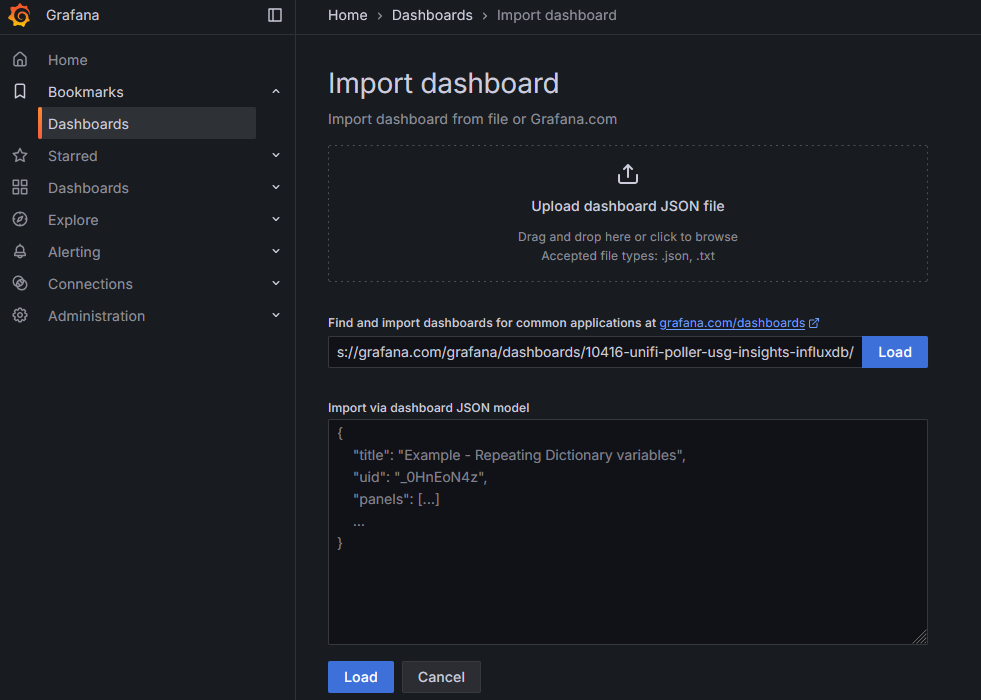
Select data source: Influxdb-unifi and press import 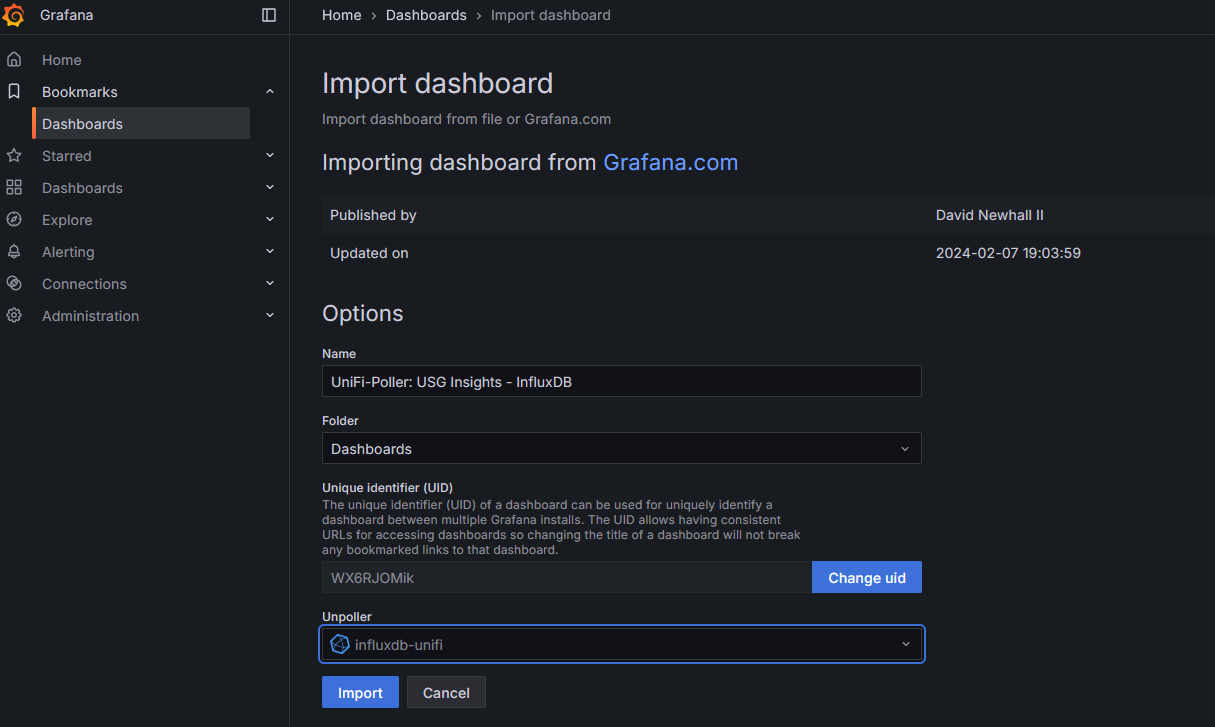
Some dashboard may not work or stop working in the future, because of plugins deprecations and influxdb language updates.
For example some dashboard won’t work because they are not written in Flux.
For that reason I’ve created my own dashboard, which you can download here
Dashboards for prometheus
Example of prometheus dashboard
I’ve not tried prometheus dashboards, so cant provide much info about that, useful I know!
Check out other posts in the series
- Hardware/software choices/alternatives [Homelab 2.0] Setting up Hardware && BIOS [Homelab 2.0] Install && Configure Proxmox [Homelab 2.0] UPS proxmox setup (+ disable UPS beeping) [Homelab 2.0] Combine NPM reverse proxy && Pi-hole DNS for Secure, seamless app local access [Homelab 2.0] Cloudflare | Pangolin - Access your homelab from the Internet over CGNAT with help of the tunnels [Homelab 2.0] Replace Google Photos with Immich and Pangolin/CF tunnels [Homelab 2.0] Qbittorrent LXC with ProtonVPN and port forwarding enabled Visualize Qbittorrent metrics in the Grafana Visualize Unifi metrics in the Grafana Self-hosted Rustdesk over pangolin tunnels