Visualize Qbittorrent metrics in the Grafana
Introduction
If you are a little metrics junkey like I’m, I’m going to show you how you can send and visualize qbittorent metrics in the Grafana via prometheus exporter called qbittorrent-exporter
What is Qbittorrent-exporter?
Qbittorrent-exporter is a Prometheus exporter for Qbitorrent written in a GO. It’s created by the martabal, so all credit goes to him.
It uses your qbitorrent admin credentials to get access to qbitorrent metrics, stores them in the prometheus and with the help of Grafana and this qbitorrent-dasbhoard let’s you visualize all interesting metrics of your downloaded ISO’s ;D
Run && Configure Qbittorrent-exporter
There are multiple ways to run this exporter. You can check them all here
The easiest one is going to be to run it as docker container. To do that simply copy this docker compose.
Don’t forget to change URL, Username and password accordingly
1
2
3
4
5
6
7
8
9
10
11
services:
  qbittorrent-exporter:
    image: ghcr.io/martabal/qbittorrent-exporter:latest
    container_name: qbittorrent-exporter
    environment:
      - QBITTORRENT_BASE_URL=http://192.168.1.10:8080
      - QBITTORRENT_PASSWORD='<your_password>'
      - QBITTORRENT_USERNAME=admin
    ports:
      - 8090:8090
    restart: unless-stopped
You can now check if the metrics are being exported properly. To do that open up a browser, input the docker container IP with 8090/metrics like so
Again change according to your info.
http://10.1.1.23:8090/metrics
Import the exported mertics into prometheus database
A - If you already have some prometheus instance
If you are already running some prometheus instance, you only need to adjust the config to scrape qbitorrent-exporter container
1
2
3
4
5
6
7
global:
  scrape_interval: 10s

scrape_configs:
  - job_name: "qbittorrent"
    static_configs:
      - targets: ["10.1.1.23:8090"]
B - If you don’t have prometheus instance
If you don’t have any prometheus instances, you can run one as a container as well.
To do so run write a simple docker compose with prometheus.conf mounted as volume like so
1
2
3
4
5
6
7
8
9
services:
  prometheus:
    image: prom/prometheus:latest
    container_name: prometheus
    volumes:
      - /opt/prometheus/prometheus.conf:/etc/prometheus/prometheus.yml:ro
    ports:
      - "9090:9090"
    restart: unless-stopped
Then simply create the config file on the host in the path we’ve specified
1
vim /opt/prometheus/prometheus.conf
1
2
3
4
5
6
7
global:
  scrape_interval: 10s

scrape_configs:
  - job_name: "qbittorrent"
    static_configs:
      - targets: ["10.1.1.23:8090"]
Change the IP to yours!
AFter that you will be left with the prometheus instance running on the port 9090
Setup new data source in the Grafana
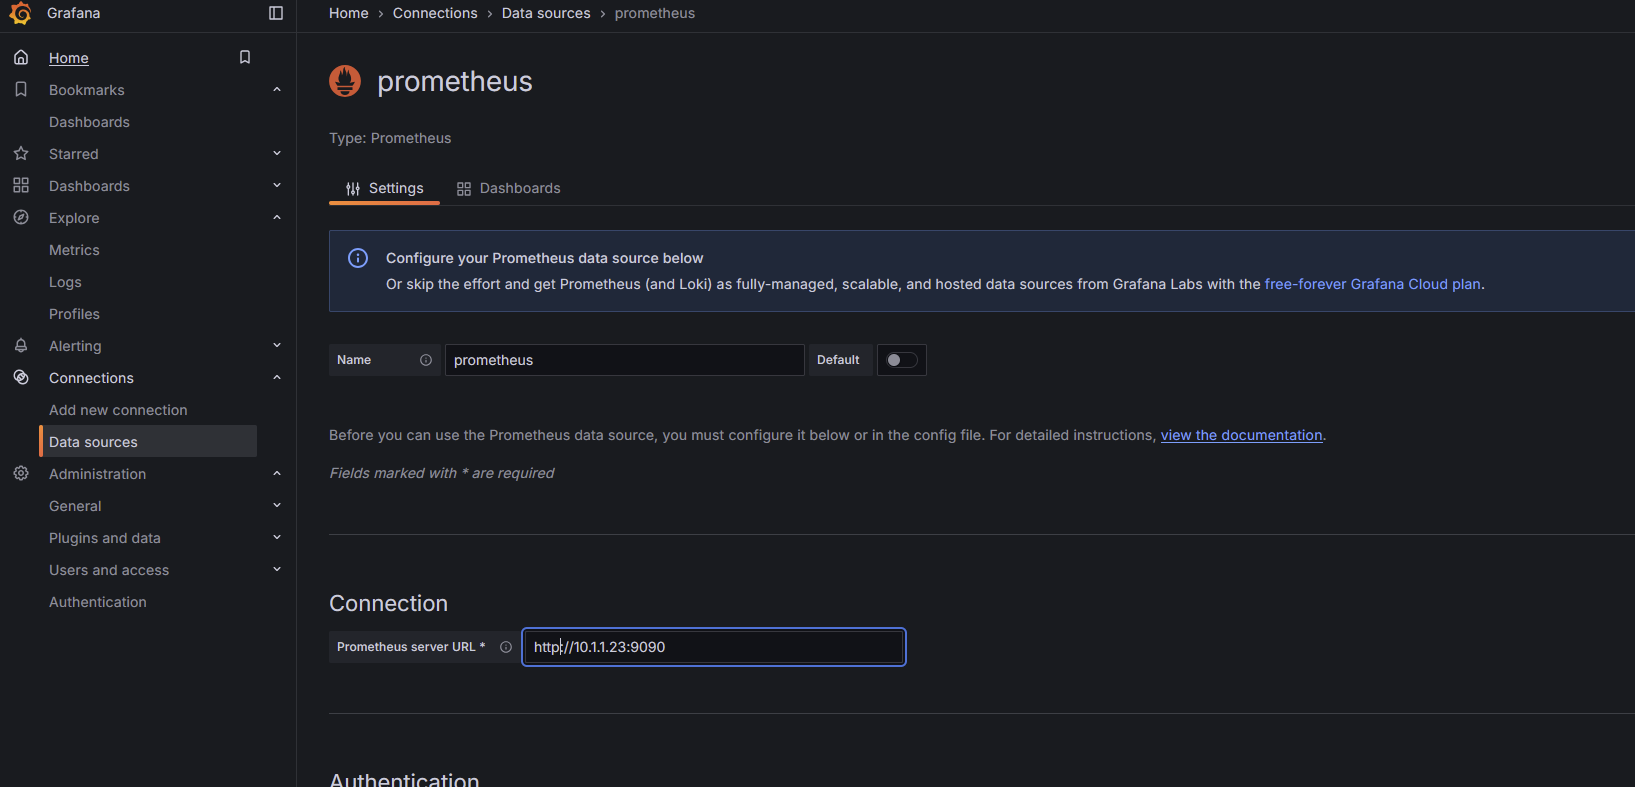
To create new data source go to your Grafana instance -> Connections -> Data sources
Add the docker container with Qbittorrent-exporter as a new Grafana data source with the type PROMETHEUS like so
Import && Configure Qbitorrent dashboard
You can either create your own dashboard or use already made one
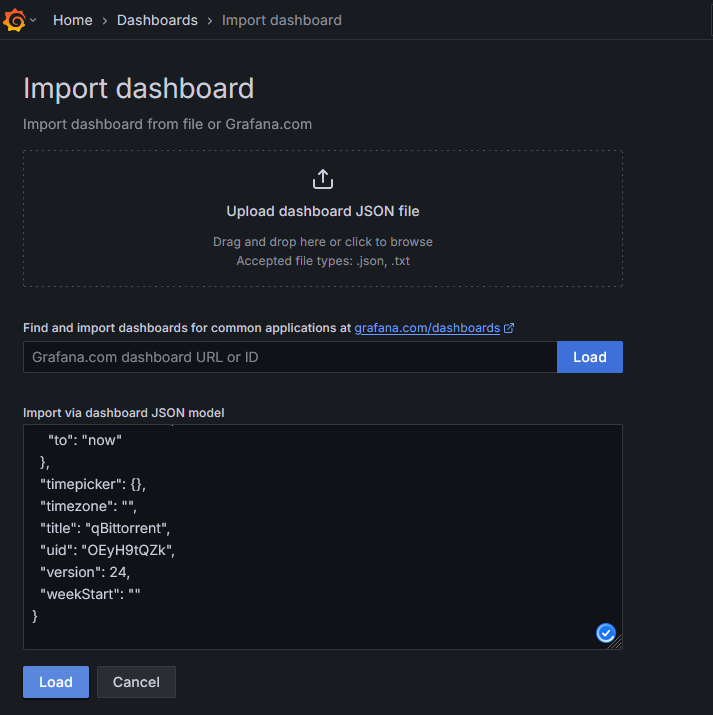
To import new dashboard go to your grafana instance -> Dashboards -> New -> Import and copy the content of the following URL to the “Import via dashboard JSON model” and click LOAD
1
2
#URL
https://raw.githubusercontent.com/martabal/qbittorrent-exporter/main/grafana/dashboard.json
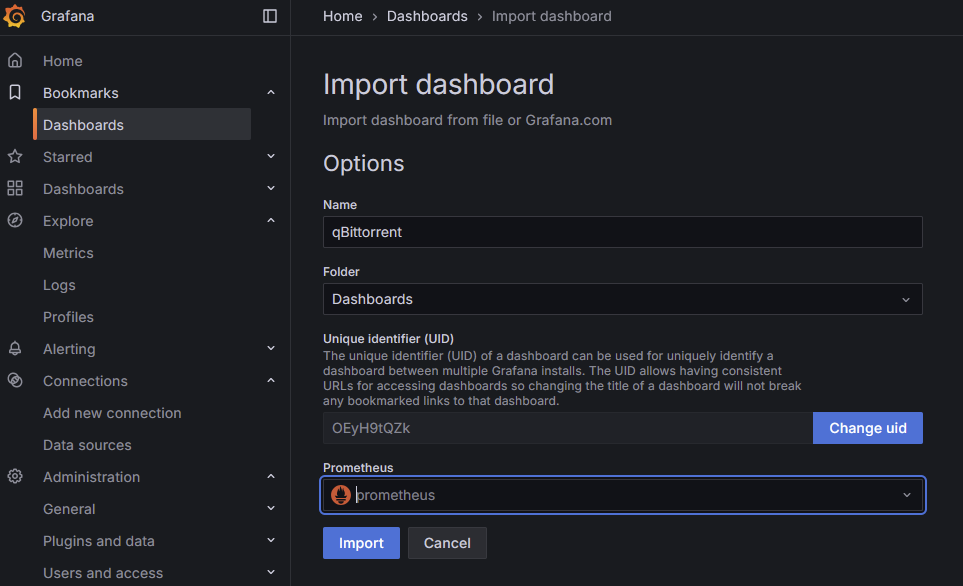
After that choose the Name, folder and most importantly the data source of prometheus instance (running on port 9090), which we have created in previous step. In our case the datasource is called “prometheus”
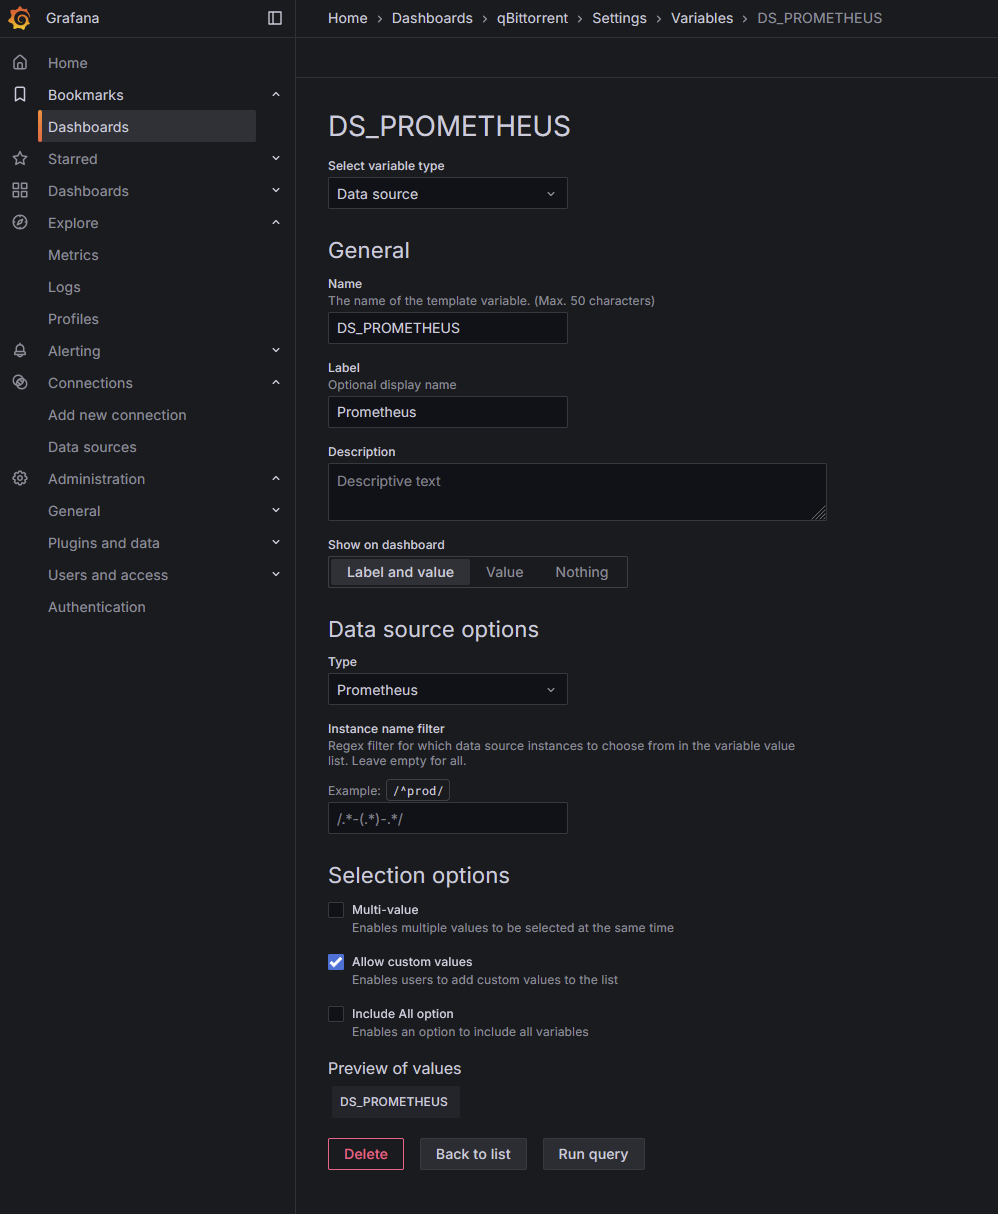
As a last step we need to add variable with the datasource name to dashboard itself Go to Grafana -> Dashboard -> qbitorrent -> Edit -> Settings -> Variables -> New variable
Select variable type: Data source Name: DS_PROMETHEUS Label: Prometheus
Change data source options -> Type: Prometheus (This is the datasouce name of prometheus instance so change according to your needs)
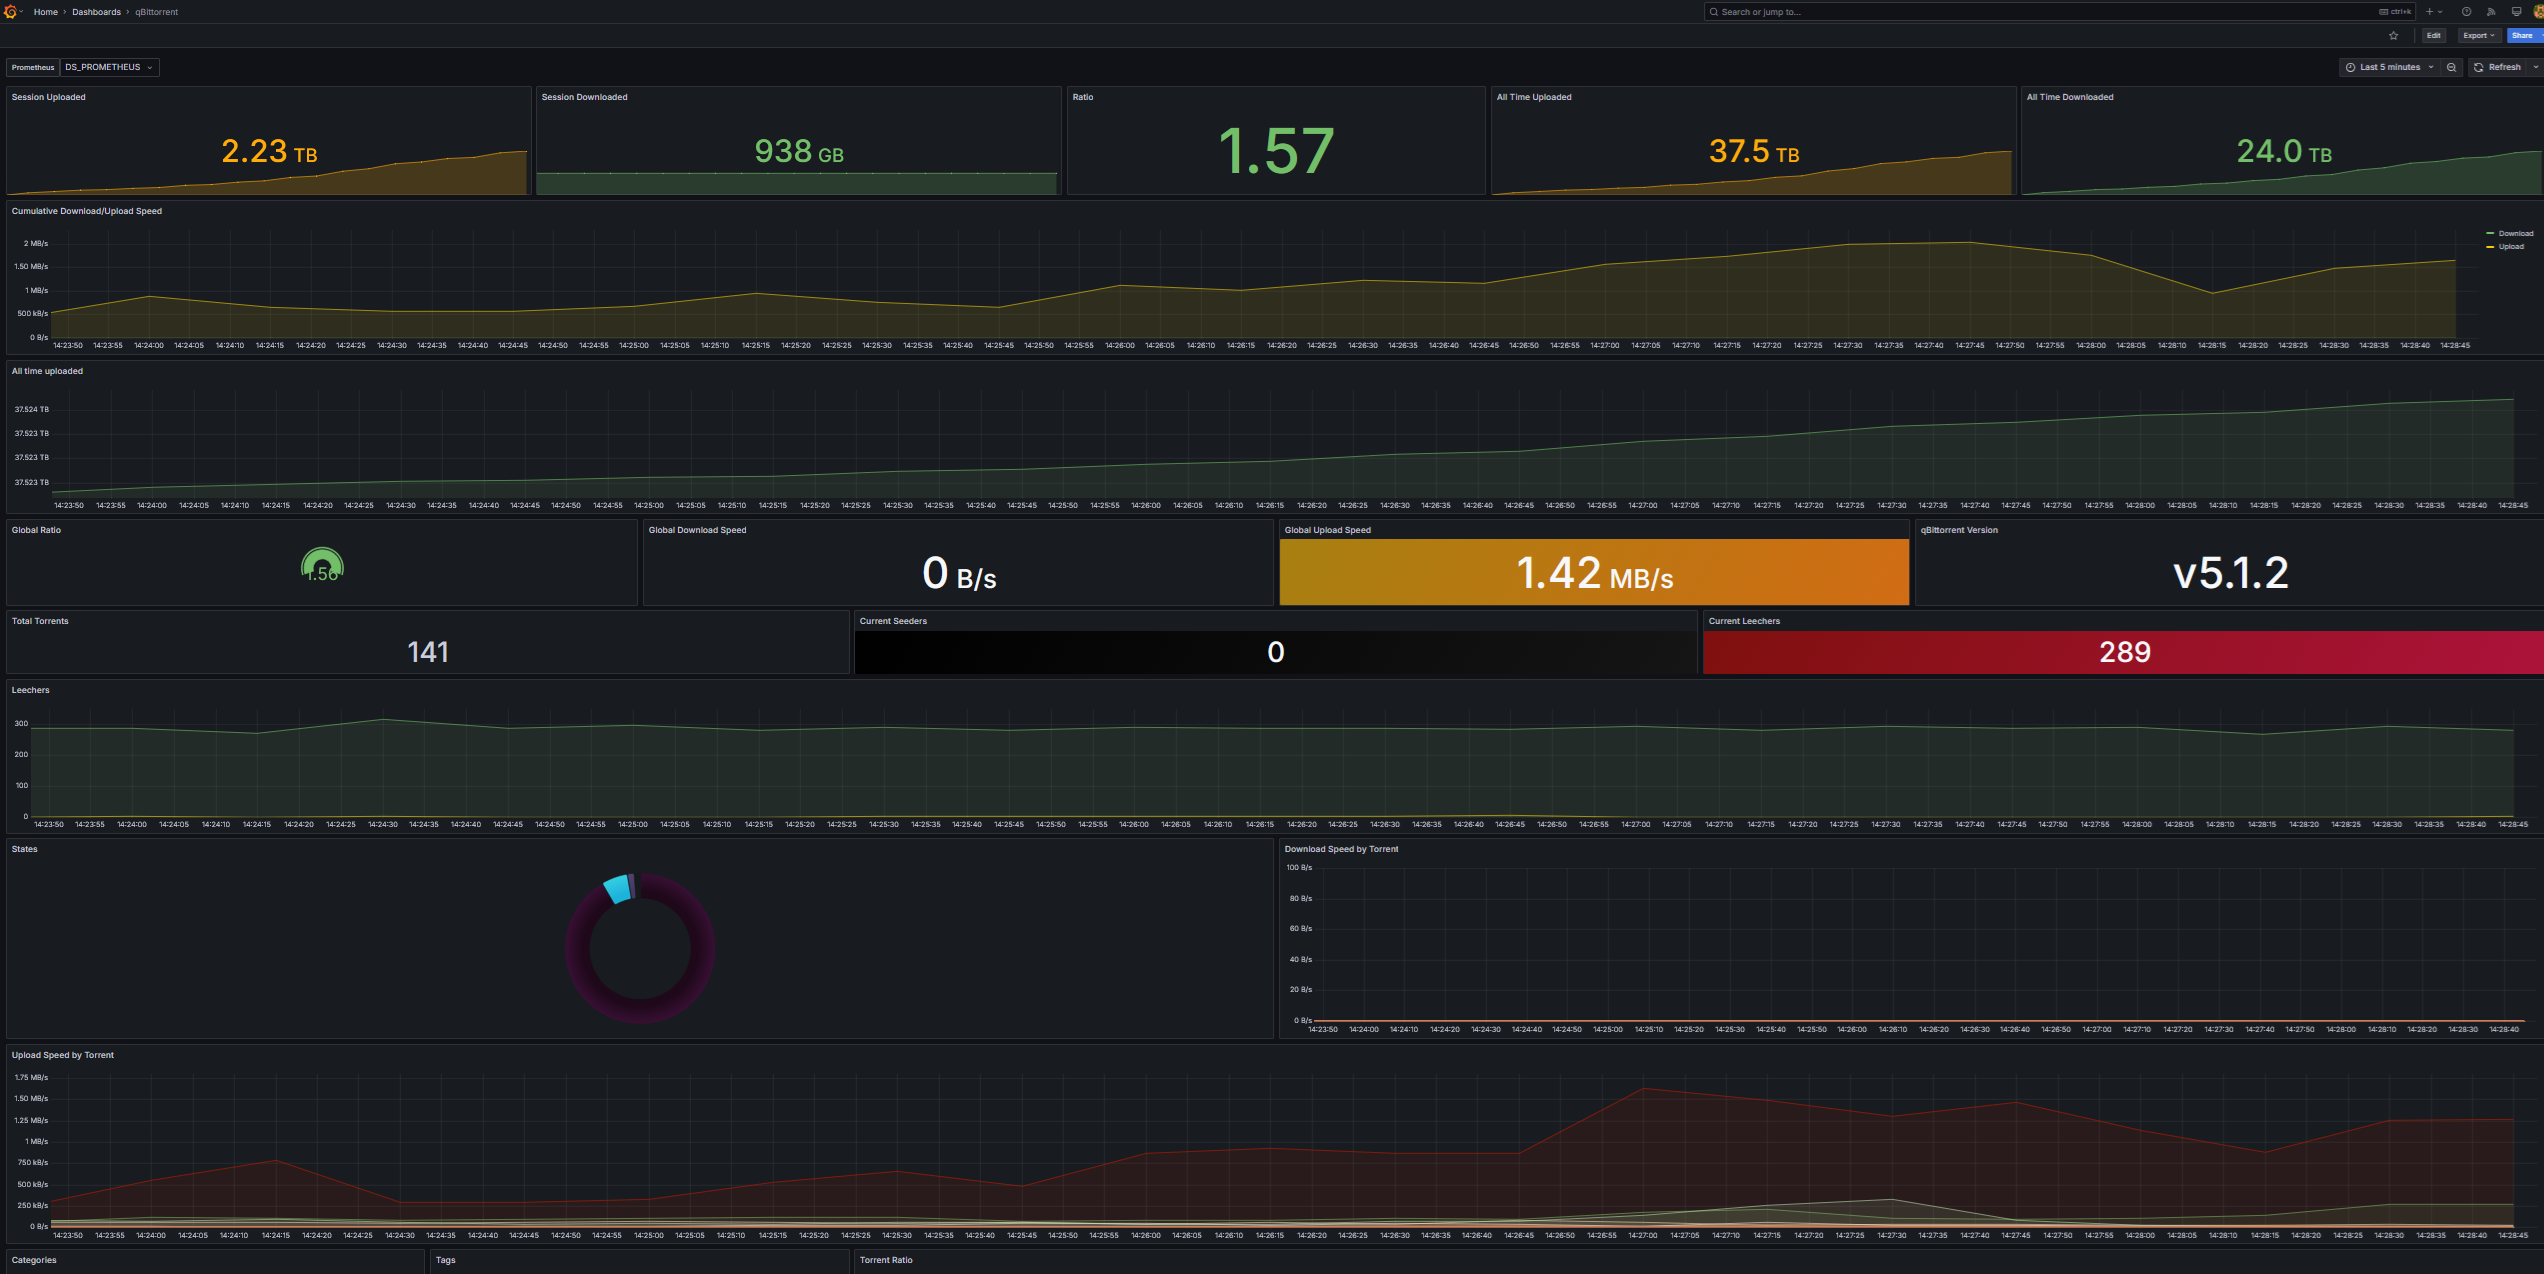
You should now see all of your qbittorent metrics!
Check out other posts in the series
- Hardware/software choices/alternatives [Homelab 2.0] Setting up Hardware && BIOS [Homelab 2.0] Install && Configure Proxmox [Homelab 2.0] UPS proxmox setup (+ disable UPS beeping) [Homelab 2.0] Combine NPM reverse proxy && Pi-hole DNS for Secure, seamless app local access [Homelab 2.0] Cloudflare | Pangolin - Access your homelab from the Internet over CGNAT with help of the tunnels [Homelab 2.0] Replace Google Photos with Immich and Pangolin/CF tunnels [Homelab 2.0] Qbittorrent LXC with ProtonVPN and port forwarding enabled Visualize Qbittorrent metrics in the Grafana Visualize Unifi metrics in the Grafana Self-hosted Rustdesk over pangolin tunnels